Pls enlighten me
-
ChaosKnight
- Posts: 293
- Joined: Sun Oct 05, 2003 6:54 pm
You can numerically generate your blackbody spectrum:
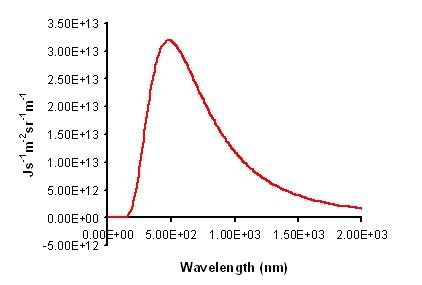
Since you are interested in radiance/energy/intensity vs frequency, you can easily get:
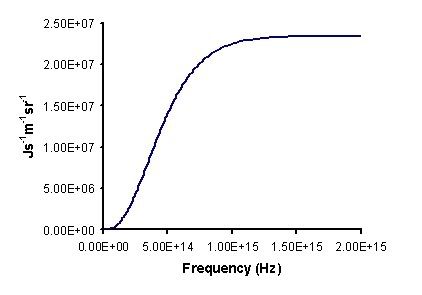
After generating all the numerical data, you can integrate it numerically to get the cumulative energy curve. Energy emitted between a spectral band is then just the difference in readout between the upper/lower frequency bounds.
The graphs generated and plotted is for a blackbody of temperature 6000K.
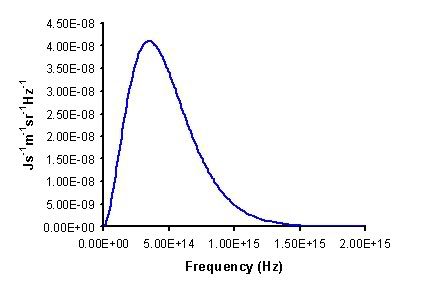
Since you are interested in radiance/energy/intensity vs frequency, you can easily get:
After generating all the numerical data, you can integrate it numerically to get the cumulative energy curve. Energy emitted between a spectral band is then just the difference in readout between the upper/lower frequency bounds.
The graphs generated and plotted is for a blackbody of temperature 6000K.
Yes, that's what I was intending too. All you need is to use the Planck's Law to generate the black-body curve, you can get a good fit. You probably do not require the actual flux densities I believe. The spectra data published are more useful in determining the elements present and the relative abundance. That's probably why SDSS publish the relative heights rather than the actual flux densities. Correct me if I'm wrong here.